Jeffrey Gundlach On Bonds, Tariffs And Bitcoin
Gundlach:
"Bitcoin is the Dot Com of our world today." CNBC.com video above published Apr 4, 2018:
Jeffrey Gundlach, CEO of
Doubleline Capital (Domain: doubleline.com), talks bonds, tariffs and bitcoin in an exclusive interview on CNBC's "Fast Money." See also
Doubleline Funds webcast-schedule and
bitcoin price.
Note also:
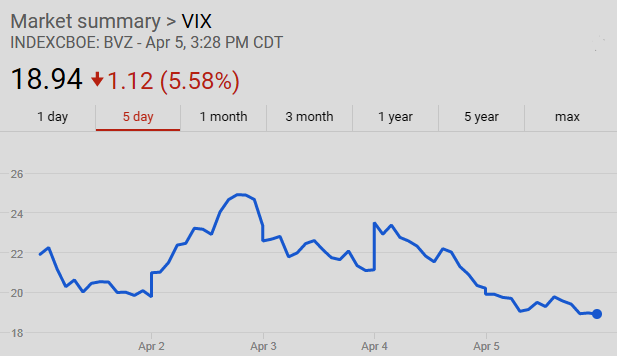
VIX
The Chicago Board Options Exchange (CBOE) Volatility Index, known by its ticker symbol VIX, is a popular measure of the stock market's expectation of volatility implied by S&P 500 index options.
U.S. Commerce Secretary Wilbur Ross Reacts To China's New Tariffs
CNBC.com video above published Apr 4, 2018: In an interview with CNBC, U.S. Commerce Secretary Wilbur Ross says China's new tariffs do
not represent a threat to the United States.
NASDAQ Composite UP 2.5% YTD:
The
NASDAQ Composite (ticker symbol IXIC) is a stock market index of the common stocks and similar securities (
e.g. ADRs, tracking stocks, limited partnership interests) listed on the NASDAQ stock market. Along with the Dow Jones Industrial Average (a/k/a Dow or DJIA) and S&P 500 Index, it is one of the three most-followed US stock markets' indices. The composition of the NASDAQ Composite is heavily weighted towards information technology companies.
The Dow’s (
DJIA 30 stocks) decline for the year-to-date primarily comes down to 5 stocks which give a better narrative than the media of how tariff issues are affecting US equity prices: 3M; Caterpillar; Home Depot; Proctor & Gamble; Walmart.


 and S&P 500 show a \"roller coaster ride\"")
