Showing posts with label Forecast. Show all posts

2019-02-15

US Preeminence & Investing, Goldman Sachs Sharmin Mossavar-Rahmani

Catch-Up With David: with Goldman Sachs' Sharmin Mossavar-Rahmani

In this episode of Catch-Up With David, Goldman Sachs CEO David Solomon sits down with chief investment officer of Goldman Sachs’ Private Wealth Management, Sharmin Mossavar-Rahmani to discuss her experience growing up in Iran, an early career pivot from engineering to investing and the relevance of using history to guide clients’ perspective. Since launching her view on US preeminence over a decade ago, US assets have outperformed those of other developed and emerging markets, and have already exceeded her forecast for 2019. “When we talk about American preeminence and look at the various drivers of that preeminence, they are things that last forever,” Mossavar-Rahmani said of the foundational themes that underpin her investment view.

A member of the firm’s Quarter Century Club, Mossavar-Rahmani describes how her unlikely journey to the field of finance has paid off, “Even though I didn’t actively choose to be in this sector, it has been one of the most interesting areas to be in, in that everything that goes on in the world, one has to pay attention to …whether it’s economics, whether it’s geopolitics - the geopolitics of whatever is going on, whether it’s a particular event, whether it’s something going on, for example, in the Middle East. One has to be so attentive to so many factors. It’s dynamic. There’s always new things going on, new things to evaluate.”


feedback & comments via twitter @DomainMondo


DISCLAIMER

2018-12-26

How To Invest Your Extra Cash Wisely and Financial Outlook for 2019

How To Invest Your Extra Cash Wisely

Bloomberg.com video above published Dec 13, 2018.

Vanguard (domain: vanguard.com):
Vanguard 2019 economic and market outlook (pdf)

feedback & comments via twitter @DomainMondo


DISCLAIMER

2018-06-01

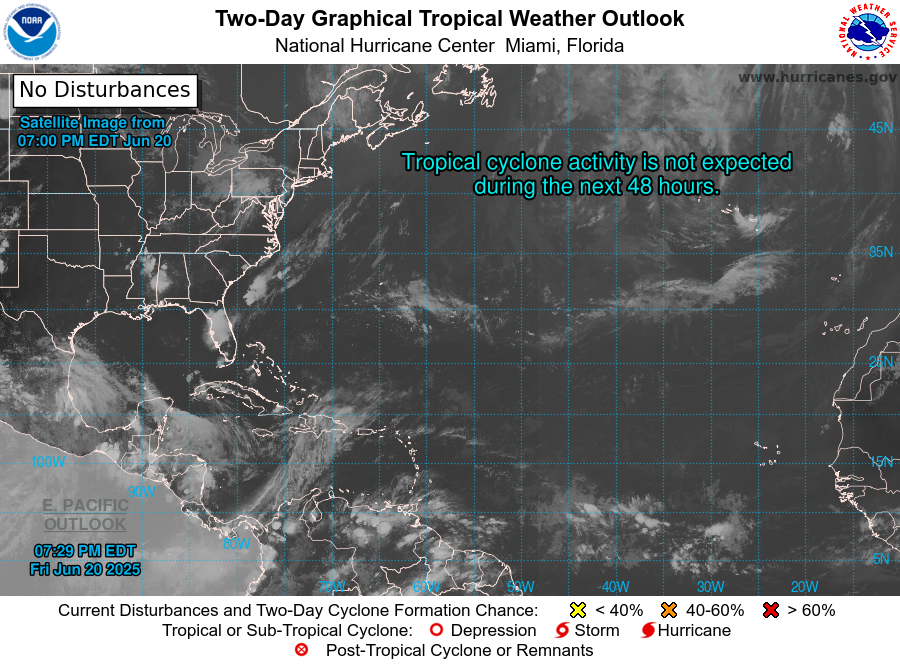
2018 Atlantic Hurricane Season Outlook & Updates

Southeast US radar:


Editor's note: The Atlantic Hurricane season runs from June 1-November 30. Five-day Atlantic Hurricane forecasts in 2017 were as accurate as two-day forecasts in 1998 due to more powerful supercomputers.
In a NOAA video published May 24, 2018, Dr. Gerry Bell, lead seasonal hurricane forecaster at NOAA’s Climate Prediction Center, and the rest of his team NOAA, predicted a 75 percent chance that the 2018 Atlantic hurricane season, June 1 through November 30, will either be near-normal or above normal, and only a 25 percent chance of a below normal season which means we can expect a likely range of 10 to 16 named storms, of which 5 to 9 are expected to become hurricanes, of which 1 to 4 hurricanes are expected to become major hurricanes of Category 3 or higher. More information: Forecasters predict a near- or above-normal 2018 Atlantic hurricane season | noaa.gov.
Latest GOES-EAST satellite imagery


Links:

feedback & comments via twitter @DomainMondo


DISCLAIMER

2018-01-08

2018 Forecasts: From US-China Trade War to Chaos in the Mideast (video)

FT Forecasts 2018: From US-China trade war to chaos in the Mideast

The FT.com's senior commentators give their big predictions for the year ahead, from a US-China trade war, to Silicon Valley (Facebook, Amazon & Google) and regulation, to Theresa May surviving as UK prime minister and chaos in the Middle East. Financial Times video above published Dec 28, 2017.

FT Forecasts 2018: A US-China trade war?

FT.com chief foreign affairs commentator Gideon Rachman predicts that next year could see the US aim tariffs at China. If China retaliates with its own tariffs we could see the beginnings of a trade war with implications for the world's trading system. Financial Times video above published Dec 26, 2017.

Are Stocks Still A Good Bet In 2018?

Here's why BlackRock.com’s Kate Moore says yes. Fortune.com video above published Dec 12, 2017.

S&P 500:
 S&P 500
 S&P 500 index up almost 32% since 4 Nov 2016

feedback & comments via twitter @DomainMondo


DISCLAIMER

2017-08-18

2017 Hurricane Season LIVE Feeds, Satellite Views, Weather App MyRadar


See also: 
NOAA (NWS & NHC) symbols:
D: Tropical Depression – wind speed less than 39 MPH
S: Tropical Storm – wind speed between 39 MPH and 73 MPH
H: Hurricane – wind speed between 74 MPH and 110 MPH
M: Major Hurricane – wind speed greater than 110 MPH

Info on Saffir-Simpson Hurricane Wind Scale (see info at the end of this post)


MyRadar | Hi-Def Mobile Radar | myradar.com: "The World's Most Popular Weather Radar App -- Over 25 million downloads" -- The weather app dominating the field of aviation with over 26 million downloads says thenextweb.com -- ACME AtronOmatic | acmeaom.com: "ACME AtronOMatic is a leading software application development company, with offices in Orlando, Florida, and Portland, Oregon. Since our inception in 1999, we've been developing applications that run the gamut from aviation-related web sites, providing flight tracking services to the aviation community, and to mobile applications such as MyRadar, a wildly-popular hi-tech, hi-resolution weather radar application for all of the popular mobile devices."


Revised 2017 Atlantic Hurricane Season Outlook:
2017 Hurricane Season


Saffir-Simpson Hurricane Wind Scale
The Saffir-Simpson Hurricane Wind Scale is a 1 to 5 rating based on a hurricane's sustained wind speed. This scale estimates potential property damage. Hurricanes reaching Category 3 and higher are considered major hurricanes because of their potential for significant loss of life and damage. Category 1 and 2 storms are still dangerous, however, and require preventative measures. In the western North Pacific, the term "super typhoon" is used for tropical cyclones with sustained winds exceeding 150 mph. source: National Hurricane Center, Miami
Saffir-Simpson Hurricane Wind Scale chart
The End of Hurricane Maria - the final NWS NHC Advisory Sep 30, 2017
feedback & comments via twitter @DomainMondo


DISCLAIMER

2016-02-08

What Happened to LinkedIn? $LNKD Stock Down 58% Since Nov 10

LinkedIn 1-year stock chart (NYSE:LNKD) (source: google.com)
What happened to LinkedIn (NYSE:LNKD)? The stock is now down 58% since Nov 10--the shares started tanking in after-hours trading last Thursday after reporting financial results which beat expectations for revenue and profit in the fourth quarter and showed solid growth, but the company's forecast for the current quarter and year disappointed investors--2016 first quarter earnings guidance of 55 cents per share (analysts' were expecting earnings of 74 cents per share), and LinkedIn forecast revenue of $820 million (analysts were projecting revenue of $866.86 million)--

"We will now end the call with our outlook for the first quarter and full year. For the first quarter, we expect: revenue of approximately $820 million, representing 29% percent growth. Adjusted EBITDA of approximately $190 million, a 23% margin. And Non-GAAP EPS of approximately $0.55 per share. For the full year, we expect: Revenue between $3.6 billion and $3.65 billion, a range of 20% to 22% year-over-year growth. This includes a 2% FX headwind. It also incorporates removing $50 million of potential Bizo revenue contribution in 2016. Adjusted EBITDA of between $950 million and $975 million, a 27% margin at the midpoint. And non-GAAP EPS of approximately $3.05 to $3.20 per share." --LinkedIn (LNKD) Jeffrey Weiner on Q4 2015 Results - Earnings Call Transcript | Seeking Alpha

So what's wrong? LinkedIn: Why So Surprised At The Drop? | Seeking Alpha: "... the investment community is starting to realize that the 30%+ growth rates are gone and that the lower growth does not support the current stock price. Hence the correction. LinkedIn is not Facebook (FB) ... Growth is slower and margins are lower."

Stocks in the whole tech sector have seen losses this year, as investors continue to closely examine "Internet valuations." See: Tech-stock wreck destroys $529B this year and Bye-bye Internet bubble 2.0 (USA Today). There are, of course, other views of what happened to LinkedIn, one of which you can read here and here.

Domain: LinkedIn.com


Tweets about $LNKD


DISCLAIMER

2015-12-06

Worldwide Smartphone Marketshare by Geography, OS, 2015-2019


Graphic above: 2015-2019 Marketshares IDC Forecast. China, US, Europe decrease, India and "Rest of the World" increase (in terms of percentage of global total marketshare).

IDC Worldwide Smartphone Forecast by OS – Shipments, Market Share, Year-Over-Year Growth, and 5-Year CAGR (Compound Annual Growth Rate) (shipments in millions):

Region2015* Shipment Volumes2015* Market Share2015* YoY Growth2019* Shipment Volumes2019* Market Share2019* YoY Growth5 year CAGR
Android1,161.181.2%9.5%1,538.182.6%4.8%7.7%
iOS226.015.8%17.3%263.414.1%3.1%6.5%
Windows Phone31.32.2%-10.2%43.62.3%11.4%4.5%
Others11.30.8%-16.8%17.10.9%6.5%4.7%
TOTAL1,429.8100.0%9.8%1,862.3100.0%4.7%7.4%

*Forecast data; source: IDC Worldwide Quarterly Mobile Phone Tracker, December 2, 2015.
Note: Apple's (iOS) OS global marketshare declines (2015-2019) from 15.8% to 14.1%.

Worldwide Smartphone Market Will See the First Single-Digit Growth Year on Record, According to IDC (press release): "Android's market share is expected to grow slightly from 81% in 2015 to 82% over the forecast period [2015-2019]. Despite numerous attempts by "alternative platforms" to enter the market, none have proved successful. IDC believes the proliferation of the core Android platform will continue with huge efforts being put forth by companies like Cyanogen and Xiaomi to differentiate themselves from their competitors. Given its global footprint and application/services ecosystem, IDC fully expects some form of Android to hold a dominant share of the smartphone OS space for the foreseeable future."

See also:


DISCLAIMER

2015-07-22

The Apple MISS Is BIG: iPhone Shipments, Revenue Forecast (video)

UPDATE (July 23, 2015): US Senator Al Franken has written the US Attorney General Loretta Lynch and FTC Chairwoman Edith Ramirez asking for a Justice Department and FTC investigation into whether Apple is engaging in anticompetitive behavior in the music streaming market--letter here (pdf). 


Apple’s iPhone shipments for the fiscal third quarter and the company’s revenue forecast for the current period missed analysts’ projections, raising questions over whether demand for the device has peaked. Technalysis Research Founder and Chief Analyst Bob O'Donnell, Creative Strategies Principal Analyst Ben Bajarin and Bloomberg's Mike Regan speak on "Bloomberg West" in the video above, on July 21, 2015.

Not a good day (July 21, 2015) for Apple--both Apple iPhone shipments and the revenue forecast for 3Q 2015 missed estimates and the stock took a tumble in after-hours trading, which if it holds when regular trading resumes Tuesday, July 22nd, could result in the second largest one-day loss of market capitalization in the world's largest company, Apple, as measured by total stock market capitalization. NASDAQ:AAPL.

While Apple sold 47.5 million iPhones, a 35 percent gain, in the period that ended in June, the analysts had anticipated 48.8 million shipments, and Apple is expected to exceed estimates. To add insult to injury, Apple forecast revenue of $49 billion to $51 billion in its fiscal fourth quarter, which ends in September, short of the average estimate for $51.1 billion, according to Bloomberg: "Any indication of slowing demand for iPhones could spark concern that Apple is going to have a hard time selling more smartphones in the final months of the year."

Check the stock: NASDAQ:AAPL
Principal domain name: apple.com
Apple Investor Relations: investor.apple.com

See also: 

Domain Mondo archive