Showing posts with label map. Show all posts

2019-01-23

Startup What3Words Global Geocoding System of 3 Square Metres

An Address for Every Place on Earth

Freethink.com video above published Dec 28, 2018: "We take addresses for granted - but billions of people and places don’t have them, and it’s a big problem. Whether it’s voting, disaster relief, or pinpointing a spot on festival grounds, not having an address makes things that should be simple difficult. Enter Chris Sheldrick, who coordinated events in the music industry where he was frustrated by address-related problems. He created What3Words, a method of dividing the entire world into 3 meter-by-3 meter squares using a set of three common words as addresses. It’s being used everywhere from Mongolia to South Africa for everything from emergency services to pizza delivery. In this interview, Chris Sheldrick describes the problem, how he came up with the idea, and how you can find ways to change the world on your own."
what3words is the simplest way to talk about location. It has divided the world into a grid of 3m x 3m squares, each with a unique address made from 3 words. Now people can refer to any precise location – a delivery entrance, a picnic spot or a drone landing point – using three simple words. what3words is helping improve businesses around the world, and paving the way for social and economic progress in developing nations. It can be used via the free mobile app or online map. what3words can also be built into any other app, platform or website, with just a few lines of code.--what3words.com

Many places lack a system for addresses. What3Words’ solution is to give every spot a three-word designation. Featured in the Sept. 3, 2018 issue of Bloomberg Businessweek.

Domain: what3words.com


feedback & comments via twitter @DomainMondo


DISCLAIMER

2017-08-21

Solar Eclipse LIVE, August 21, 2017

NASA TV
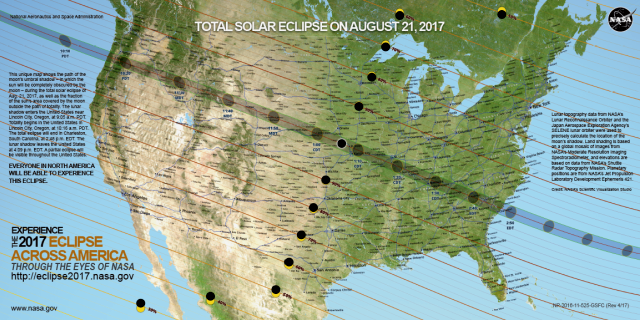
Solar Eclipse Map August 21, 2017
https://eclipse2017.nasa.gov/sites/default/files/publications/NASA_map_508.pdf
Solar Eclipse 21 August 2017 Map
On August 21, 2017, a total solar eclipse will cross the continental United States from coast to coast for the first time in 99 years. If skies are clear, people in North America will be able to see a partial or total solar eclipse. You can find out what the eclipse will look like in your area, and make sure you have a safe method to watch.

You can also tune into nasa.gov/eclipselive throughout the day on Aug. 21 to see the eclipse including a NASA TV show, views from spacecraft, aircraft, and more than 50 high-altitude balloons.

More eclipse information at:
source: https://eclipse2017.nasa.gov/


feedback & comments via twitter @DomainMondo


DISCLAIMER

2015-08-06

China has more Internet users than US, India, and Japan combined (maps)

Map of Internet Users in the World by country and percentage of population online
Above: Map  of the Global Internet Community - source: The World Online | Geonet,  Ralph Straumann and Mark Graham,
 Oxford Internet Institute, University of Oxford, England. This work is licensed under CC BY-NC 3.0
The global Internet community: the above map shows the total number of Internet users in a country (size of the country) as well as the percentage of the population that has Internet access (shade of the country). It is an update of the Oxford Internet Institute 2011 visualization.

Data and Method: The map uses 2013 data on Internet users and population that was obtained from the World Bank. The World Bank has tracked the number of Internet users per country since the 1990s as part of its Worldwide Governance Indicators project. The data is visualized using a hexagonal cartogram (a distorted map). In this cartogram, the size of each country is drawn based on the absolute number of its Internet users, while keeping the countries’ and continents’ shapes as close to their true shape as possible. Each small hexagon accounts for about half a million people online. Countries with fewer Internet users do not show up in the cartogram. Note the small inset map showing the actual relative sizes of the continents. The shading of each country in the cartogram represents the share of the population that has Internet access (the so-called Internet penetration): darker shades indicate higher rates of Internet access among the population.

Findings:

1. The continued rise of Asia as a major home region to the world’s Internet population. At 1.24 billion users, 46% of the world’s Internet users live in Asia. That is roughly equal to the number of Internet users in Europe, Latin America & Caribbean, Middle East & North Africa, and North America combined.

2. China is home to the world’s largest Internet population of a country at 600 million people. The United States, India, and Japan then follow as the next most populous nations of Internet users with 270 million, 190 million, and 110 million people online, respectively. Even though a majority of Chinese people have never used the Internet, China has more Internet users than the US, India, and Japan combined.

India is projected to overtake China as the world's most populous country in 2028, according to the United Nations. At that point, both nations will number 1.45 billion people. Subsequently India's population will continue to grow until the middle of the century, while China's slowly declines. But India is lagging compared to China in its Internet infrastructure and Internet population. Why?--

A digital roadmap (eiu.com): "Growing numbers of India's 1.3 billion population are engaging with digital technology, using smartphones and tablets to access a range of internet-based services and applications. India is currently the fastest-growing smartphone market in the world, and yet its internet and broadband penetration rates are low when compared with its high-growing BRIC nation counterparts. The Economist Intelligence Unit expects the broadband penetration rate in India to rise only marginally, from 1.7% in 2014 to 3.3% in 2019. According to recently published government data, only 100 million people had broadband connections as of April 2015. Overall internet penetration will rise further, to 56.7% in 2019, from 19.7% in 2014. But for a country that is expected to become the world's second-largest internet market by 2019 in terms of users (totalling 755 million), its penetration rate will remain behind that of Russia (71%), China (66%) and Brazil (65%). Lagging average internet connection speeds—for which India has been ranked 115th worldwide, according to research by Akamai Technologies—will leave India further trailing rival emerging markets in the digital race." (emphasis added)

Meanwhile China's lack of internet freedom continues to hinder its population and economy:

China to Set Up ‘Security Offices’ Inside Internet Companies - Bloomberg Business: The Ministry of Public Security will add police officers at “critical” companies to help boost defenses against cyber-attacks and fight criminal activity, the state-run Xinhua News Agency reported, citing a ministry conference.

China to set up Internet police in tech firms | Seeking Alpha:
  • China is setting up cybersecurity police units at major Internet companies, a move aimed at strengthening the government's grip on the world's largest population of Web users.
  • The officers will be added to help boost defenses against crimes such as fraud and "spreading of rumors."
  • Beijing is also discussing a separate plan to build a national cyber safety net, enabling national and local governments to cut Internet access when needed.

As Domain Mondo has noted before (see: Domain Mondo: Domain Name Registrations and the Global Internet Population), there are three "must haves" which provide the foundation for a viable domain name industry in a given market or country:
  1. Internet access which is fast (broadband/4G) and affordable to the local population;
  2. Internet freedom (absence of censorship);
  3. High GDP (gross domestic product) per capita (see map below) or high GNI per capita.
Which is why the domain name industry (and most domain name registrations) are heavily concentrated in North America-Europe-Australia/New Zealand.

Global map of countries showing GDP per capita (nominal) 2014
"GDP per capita (nominal) 2014" by Sarah Biddle - Own work. Licensed under CC BY-SA 4.0
via 
Wikimedia Commons
See also Domain Mondo: Internet Broadband Affordability Map, A Global Digital Divide


2015-07-20

Internet Broadband Affordability Map, A Global Digital Divide

Global Map of Internet Broadband Affordabiity
Internet Broadband Affordabiity Map, A Global Digital Divide - source: Oxford Internet Institute, University of Oxford
This work is licensed under CC BY-NC 3.0.
The above Oxford Internet Institute (OII) map presents an overview of broadband Internet affordability, as the relationship between average yearly income per capita and the cost of a broadband subscription.

Data: The map uses the “Fixed (wired)-broadband monthly subscription charge, in USD” indicator published by the International Telecommunication Union (ITU) in the 17th edition of the World Telecommunication/ICT Indicators Database, using 2011 data--the most recent information available for this indicator in the dataset. The ITU defines the indicator as the following: “Fixed (wired)-broadband monthly subscription charge refers to the monthly subscription charge for fixed (wired)-broadband Internet service. Fixed (wired) broadband is considered to be any dedicated connection to the Internet at downstream speeds equal to, or greater than, 256 kbit/s. If several offers are available, preference should be given to the 256 kbit/s connection.”

The data also refers to the monthly cost of the cheapest entry-level subscription in any place. These values have been multiplied by twelve to obtain a yearly cost, and weighted over the gross national income per capita (Atlas method, current USD) data available from the World Bank, referring to the same year (2011). The graph on the lower-left corner illustrates the evolution of the cost of broadband over time.

Findings: This visualization speaks to one of the core themes of the global digital divide: the relative cost of being connected to the Internet. The price of a broadband connection in most parts of Africa is out of reach for people on average incomes. Africans need to pay ten times as much of their salary (if looking at the ratio of income to connectivity costs) for broadband as people in the rest of the world.

A monthly broadband subscription costs about 60 USD both in Australia and Mozambique. However, while the average yearly gross income in Australia is around 50,000 USD, the same figure in Mozambique is less than 500 USD. This means that while an average worker in Australia could pay for a year’s worth of connectivity with one week’s salary, a Mozambican worker would need over one and a half year’s salary. The average cost of an African Internet connection is now half of what it was four years ago, thanks to a series of cables laid around the African continent in 2009. Kenya and Nigeria, for instance, have 2011 broadband costs that are respectively 21% and 8% of what they were in 2008. These changes have undoubtedly contributed to the significant growth in the number of Internet users seen by both countries. The most striking drop in broadband cost has been observed in Burkina Faso, which has gone from over 1,700 USD a month to a most reasonable 55 USD (which still, however, represents 100% of the salary of an average worker).

Eritrea is the country where the Internet is least affordable. A yearly subscription there is the equivalent of almost fifty year’s worth of an average salary: an entire life of work! Over 18 countries still face costs of Internet subscriptions higher than the average income, including 14 Sub-Saharan African countries, the landlocked countries of Afghanistan and Tajikistan, and the islands of Kiribati and Solomon Islands. A broadband Internet connection cost over 500 USD a month in the Central African Republic, Guinea, Malawi, and Swaziland, as well as in Cuba, where, according to the ITU, 1,700 USD was still not enough to buy a subscription.

India and Sri Lanka have the cheapest broadband access prices, where access can be obtained for as little as 6 USD a month. Europe and North America have higher absolute costs, ranging between about 10 and 40 USD a month, but have some of the lowest relative costs in the world: with a couple of hours of work a month being sufficient for an average worker to afford the cost of connectivity.

Without the ability and means to connect, opportunities, information, and communication made possible by the Internet remain "out of reach."(Source: Oxford Internet Institute, University of Oxford under CC BY-NC 3.0)

Conclusion: if you are trying to establish a viable market for domain names in an area where internet is not affordable--examples: Africa, Cuba, and areas of the developing world--good luck! 

See also:

2015-05-18

Internet Backbone Bandwidth Boom Driven By Content Provider Networks

Global Submarine Cable Map
Global Submarine Cable Map - Source: Greg's Cable Map (GPLv3)


"Cables lying on the seafloor bring the internet to the world. They transmit 99 percent of international data, make transoceanic communication possible in an instant, and serve as a loose proxy for the international trade that connects advanced economies." -Vox
"...The United States is by far the most connected country in the world, with submarine cable landing points on both coasts that connect it to most other continents..." (source: Oxford Internet Institute)

Thumbnail of telegeography.com's Global Internet Map 2012
At left: thumbnail from Telegeography.com's Global Internet Map 2012 shows major US internet backbone hub gateways--New York City, Washington, D.C., Miami, Los Angeles, San Francisco metros--as well as the number one hub in the world in capacity in 2011: London (UK). Over 11 Tbps of international Internet capacity connected to London in 2011.

New data from TeleGeography and its Global Bandwidth Research Service indicates international bandwidth grew 44 percent in 2014, to reach 211 Tbps. The 65 Tbps of new capacity deployed in 2014 equals nearly the entire amount of bandwidth in service globally in 2011. This rapid capacity growth is driven by a changing mix of global network operators--private networks, particularly those of large content providers like Google, Facebook, and Microsoft, account for a growing share of international bandwidth, even surpassing public Internet bandwidth on the trans-Atlantic route last year. As a result, network operation is now a core part of the business for some of the largest content providers. Opportunities still exist for traditional network operators as not all wholesale customers can achieve the large scale of content companies, leaving substantial demand for purchases of increments of capacity.

Web Companies Driving Construction Boom at Internet’s Core - WSJ: "... Google has been an aggressive builder of network pipes. The company helped build a trans-Pacific submarine cable finished in 2010 and is in the process of funding another one. The company also took a one-third stake in another fiber optic cable that will link the U.S. to Brazil... A Google spokeswoman said the network investments allow the company to provide users with better, faster services. Facebook and Microsoft are also investing heavily in the building blocks of a private global network. The pair helped secure funding for a new cable called AEConnect between Ireland and the U.S., according to a person familiar with the matter..." 

Google Peering & Content Delivery: "... How does Google deliver traffic to users? In the core: We invest and build our global backbone network to connect our data centers and transport traffic to Internet aggregation points. We carry traffic as far as possible on our own network. At the edge: We peer directly with access network operators and ISPs. Google treats all operators equally with an open, settlement-free peering policy. Beyond the edge: We deploy the Google Global Cache platform in access providers' networks to deliver content even closer to users, and reduce transport costs for operators..."

China Approves New Crossing-Pacific Cable Project"A new multinational crossing-Pacific submarine cable project which directly connects China and the US has been approved by China's National Development and Reform Commission. China's three telecommunication giants, China Telecom, China Unicom and China Mobile, together with companies from several other countries and regions, will jointly contribute to the funding and construction. The project is designed with a total length of around 14-thousand kilometers and a total capacity of 60 Tb/s...." (May 2, 2015)

Other references:

2014-07-28

Interactive World Map of Sunrise Tweets


Sunrise around the world (via Twiiter)- Geotagged Tweets mentioning 'sunrise' in different languages, April 6, 2014, GMT


Domain Mondo archive